Table Of Contents
PLPython Part 3: Using custom classes, pulling data from PostgreSQL Intermediate
PLPython Part 4: PLPython meets aggregates Intermediate
How to create multi-column aggregates Intermediate
PLPython Part 5: PLPython meets PostgreSQL Multi-column aggregates and SVG plots Advanced
From the Editors
PostGIS Raster and More
The OSGEO Toronto Sprint
The OSGEO C-Camp Toronto Sprint was fun, although Leo and I couldn't stay for the whole event. I've never seen people close bugs so quickly. Paul Ramsey and Mark Cave-Ayland were on a marathon run in the PostGIS ring. Olivier Courtin was also following not too far behind with SVG bug fixes and so forth. We also discussed the possiblity of having ST_GeomFromGML, ST_GeomFromGeoJSON, ST_GeomFromKml and so forth and what that would entail. It was great to meet Pierre Racine of WKT Raster fame in person and chat with Mateusz and Sandro Santilli via IRC. Frank Warmerdam, the GDAL god came to our table to provide his big two cents about how WKT Raster meta data should be stored, dealing with large RASTERS and other things I didn't understand.Mark Leslie in Australia did his part too, though he wasn't present -- he would come into IRC when others had fallen asleep. Such is the way with timezones. He has been working on beefing up the curved support in PostGIS. The FOSS 4G 2009 conference will be in Sydney, Australia.
It was nice to be able to put a face to these people I've talked via newsgroups. It was also strange since most of the clients and many of the people we work with we have never met, so the idea of meeting in person has become a very foreign concept for us.
What is in store for PostGIS
We sat at the PostGIS table and a lot of ground was covered. On the PostGIS side, we discussed plans for PostGIS 2.0 -- specifically
- Making 0 the unknown SRID instead of -1 to conform with OGC standards
- Introducing Geodetic support and possibly integrating Q3C for indexing support for geodetic.
- More extensive projection support using CSMap so that we can deal with obscure projections and also utilize the well-known-text representation of spatial reference for importing shape files.
- Bringing in WKT Raster more into the PostGIS family
- Tweaking of storage and ability to expand structure to store new types -- e.g. all those X3D surface types needed for CityGML and so forth.
- Using PostgreSQL 8.3+ typmod support so we can have geometry_columns as a view instead of a real table and encoding all we need in the typmod structure to simplify adding constrained geometry columns
- Mateusz Loskot has been working on getting PostGIS to compile under Visual C++ in windows and has made a lot of headway. This will hopefully make it easier for windows users to try out cutting edge PostGIS versions and contribute more. Currently windows users wanting the latest and greatest are forced to use MingW, which is a bit of a pain to get going.
WKT Raster
I'm particularly looking forward to WKT Raster. When many think of Rasters in GIS, they think Aerial Imagery. I think aerial too, but what really excites me with Raster is its application in cellular automata, game grids, signal processing, computational biology, and all sorts of other sugar plums overlaid, intersected and differenced in space which admittedly don't necessarily have anything to do with GIS, but everything to do with spatial (by spatial I mean the use of space that need not be geographic). I think the real deal in GIS and more specifically the power of spatial analytical processing, is not GIS but the conventions and concepts it provides which are equally applicable in non-geographic problem domains. The analytical stuff planned and work already done for WKT Raster I find pretty exciting. I'm hoping we can start playing with it in the next month.
Getting more involved
On another note -- this year is going to be very busy for Leo and myself. We are going to be presenting at PGCon 2009 in Ottawa in May - doing a PostGIS Lightning talk and a PostGIS Spatial Query lecture, and another lecture in July at OSCON 2009 in San Jose, and some other new developments which we shall discuss later. So this year will be pretty interesting and exhausting. We are getting deeper into PostGIS on all fronts and if we can get thru this year all in one piece, I think it will be a major milestone for us and hopefully for PostGIS as well.
PostgreSQL Q & A
Using Microsoft SQL Server to Update PostgreSQL Data Intermediate
This article is a bit of a companion to our article on Setting up PostgreSQL as a Linked Server in Microsoft SQL Server 64-bit
In this article we shall demonstrate using Microsoft SQL Server 2005/2008 OPENQUERY AND OPENROWSET to add, delete and update data in PostgreSQL.
First we must start by saying there are a number of ways of copying data between databases. While OPENROWSET is not necessarily the fasted, in certain cases such as when you are wrapping this in a stored procedure, it is one of the most convenient ways of doing this.
Why on earth would you want to copy data back and forth between 2 servers and 2 disparate DBMS systems for that matter? We all would like to think we are an island and live in a world with one DBMS system, but we don't. There are many reasons for having multiple DBMS providers in an organization. Some are better for some things than others, some are more integrated in an environment -- (for example in a windows shop the SQL Server drivers are already loaded on all windows machines, but PostgreSQL provides the advantage of being able to run on more platforms such a FreeBSD/Unix/Linux box and with cheaper cost and more options for PL programming so is often better for a front-facing DMZ accessible database), and there are numerous other reasons that are too hard to itemize. The other question of why triggering from SQL Server instead of PostgreSQL is because its just a little easier from Microsoft SQL Server. The OPENROWSET and OPENQUERY logic that SQL Server provides is just simply better and easier to use than the dblink provided for PostgreSQL. Anyrate with that said lets move on with the show.
Although this example is focused on using PostgreSQL with Microsoft SQL Server, the same technique applies when copying retrieving updating data from other databases such as MySQL or Oracle or DB II.
OPEN what - what's the difference?
SQL Server provides two functions for doing cross server calls or pulling in files. One is called OPENQUERY and the other is OPENROWSET. The distinction is fairly simple.
- OPENQUERY - needs a reference to an already estabilished Linked server. Linked server as we discussed in our prior article.
- OPENROWSET - contains the connection string to the server/file so need not piggy back on a linked server setup. Since OPENROWSET is truly ad-hoc -- you need to
have Ad-hoc Remote Queries enabled in your SQL Server surface area configuration. Or alternatively running the below commands as admin
sp_configure 'show advanced options', 1
reconfigure

sp_configure 'Ad Hoc Distributed Queries', 1
reconfigure
The SQL Server 2005 examples below use the 64-bit ODBC driver for PostgreSQL and OLEDB Driver for ODBC. If you are using SQL Server 2008 and you have the PostgreSQL OLEDB driver installed, it appears that that is an option under installed providers though we haven't tested that out.
Doing a simple select of a PostgreSQL data
For a select from a PostgreSQL table or view or function, you can do this with a linked server, OPENQUERY or OPENROWSET. We shall demonstrate using OPENROWSET.
--SELECT example -- 64 bit ANSI driver
SELECT a.*
FROM OPENROWSET('MSDASQL',
    'Driver=PostgreSQL AMD64A;uid=pguser;Server=pghost;port=5432;database=pgdatabase;pwd=somepassword',
    'SELECT  fielda, fieldb, field2
            FROM sometable wHERE fielda LIKE ''test%'' ')
AS a;

--SELECT example -- 32-bit ANSI driver (if running 32-bit SQL SErver 2005/2008)
SELECT a.*
FROM OPENROWSET('MSDASQL',
    'Driver=PostgreSQL ANSI;uid=pguser;Server=pghost;port=5432;database=pgdatabase;pwd=somepassword',
    'SELECT  fielda, fieldb, field2
            FROM sometable wHERE fielda LIKE ''test%'' ')
AS a;
Doing a delete from a PostgreSQL table
When doing a delete you want your OPENROWSET to return the records you want to delete. In this example we are deleting all the records like 'test%'.
--DELETE data
DELETE FROM
    OPENROWSET('MSDASQL',
        'Driver=PostgreSQL AMD64A;uid=pguser;Server=pghost;port=5432;database=pgdatabase;pwd=somepassword',
    'SELECT  fielda, fieldb, field2
            FROM sometable wHERE fielda LIKE ''test%'' ')
Doing an insert into a PostgreSQL table
Here is an example of doing an INSERT. The important thing to keep in mind here is when doing an insert have your input OPENROWSET return no records.
We want our function to return no data so it just provides the field structure and an empty result set to add to.
--INSERT data
INSERT INTO OPENROWSET('MSDASQL', 'Driver=PostgreSQL AMD64A;uid=pguser;Server=pghost;database=pgdatabase;pwd=somepassword',
    'SELECT  fielda, fieldb, field2
            FROM sometable WHERE fielda = ''-1'' ')
SELECT fielda, fieldb, fieldc
 FROM sqlservertable WHERE fielda LIKE 'test%'
Updates
Simple updates not bad. You only want to select the records you wish to update.
--UPDATE data
UPDATE OPENROWSET('MSDASQL', 'Driver=PostgreSQL AMD64A;uid=pguser;Server=pghost;database=pgdatabase;pwd=somepassword',
    'SELECT  fielda, fieldb, field2
            FROM sometable WHERE fielda = ''test%'' ')
 SET fielda = 'my test'
Cross Updates doable but potentially very slow depending number of records you are pulling and updating. Things to keep in mind, include the primary key, only select the columns and rows you wish to update.
--Cross Update between PostgreSQL and SQL Server
-- Note here we alias the fields in our PostgreSQL so names don't conflict
-- with SQL Server field names
UPDATE OPENROWSET('MSDASQL', 'Driver=PostgreSQL AMD64A;uid=pguser;Server=pghost;database=pgdatabase;pwd=somepassword',
    'SELECT  mykey As pgkey, myvalue As pgvalue
            FROM sometable WHERE fielda = ''test%'' ')
SET pgvalue = tabref.myvalue
FROM tabref
WHERE tabref.mykey =  pgkey
Basics
How to create multi-column aggregates Intermediate
PostgreSQL 8.2 and above has this pretty neat feature of allowing you to define aggregate functions that take more than one column as an input. First we'll start off with a rather pointless but easy to relate to example and then we'll follow up with something a bit more interesting.
For more examples of creating aggregates in PostgreSQL, check out our other articles:
- Aug/Sept 2008: Build Median Aggregate Function in SQL
- Aug/Sept 2008: More Aggregate Fun: Who's on First and Who's on Last
- Feb/March 2009: PLPython Part 4: PLPython meets aggregates
Product Sum
We have all seen aggregate functions that take one column as argument, but what about ones that take two or three or four or more. Why would you ever want to do this? The first example we will show is one that puts me to sleep, but demonstrates the point. We'll call it the prodsum. What it does is this.
prodsum(a,b) = a1*b1 + a2*b2 + a3*b3 ....an*bn
Any astitute observer will observe that this is just a lame use of something as powerful as multicolumn aggregates because you can easily simulate it with the below. Its only nice because it allows us to validate our result.
prodsum(a,b) = SUM(a*b)
You would form the aggregate product sum by doing this
CREATE OR REPLACE FUNCTION prod_state(prev numeric, e1 numeric, e2 numeric)
    RETURNS numeric AS
$$
    SELECT COALESCE($1,0) + COALESCE($2*$3,0);
$$
LANGUAGE 'sql' IMMUTABLE;

CREATE AGGREGATE prodsum(numeric, numeric)(
    SFUNC=prod_state,
    STYPE=numeric,
    INITCOND=0
);
Now to validate that it is doing the right thing..
SELECT k,
    prodsum(i,j + k) As prodsum ,
    sum(i*(j + k)) As regsum
FROM generate_series(1,4) As i
    CROSS JOIN generate_series(1,2) As j
    CROSS JOIN generate_series(0,1) As k
GROUP BY k
ORDER BY k;


 k | prodsum | regsum
---+---------+--------
 0 |      27 |     27
 1 |      45 |     45
Something different
Now this example is a little trickier to simulate without an aggregate function that takes more than one argument, so we won't bother
funky_agg(a,b) = a10*b1 + a21*b2 ...ann-1*bn
--Funky agg CREATE OR REPLACE FUNCTION funky_state(prev numeric[2], e1 numeric, e2 numeric) RETURNS numeric[2] AS $$ SELECT ARRAY[CASE WHEN $1[2] = 0 THEN 1*$3 ELSE $1[1] + POWER($2,$1[2])*$3 END, $1[2] + 1] ; $$ LANGUAGE 'sql' IMMUTABLE; CREATE OR REPLACE FUNCTION funky_final(last numeric[2]) RETURNS numeric AS $$ SELECT $1[1]; $$ LANGUAGE 'sql' IMMUTABLE; CREATE AGGREGATE funky_agg(numeric, numeric) ( SFUNC=funky_state, STYPE=numeric[2], FINALFUNC=funky_final, INITCOND = '{1,0}' ); --The foos SELECT i,j,k FROM generate_series(0,2) As i CROSS JOIN generate_series(1,2) As j CROSS JOIN generate_series(0,1) As k ORDER BY k,i,j;i | j | k ---+---+--- 0 | 1 | 0 0 | 2 | 0 1 | 1 | 0 1 | 2 | 0 2 | 1 | 0 2 | 2 | 0 0 | 1 | 1 0 | 2 | 1 1 | 1 | 1 1 | 2 | 1 2 | 1 | 1 2 | 2 | 1 (12 rows)SELECT k , funky_agg(foo.i,foo.j + foo.k) As what FROM (SELECT i,j,k FROM generate_series(0,2) As i CROSS JOIN generate_series(1,2) As j CROSS JOIN generate_series(0,1) As k ORDER BY k,i,j) As foo GROUP BY k ORDER BY k;k | what ---+---------------------- 0 | 84.0000000000000000 1 | 135.0000000000000000
Checking our math by expanding by hand:
k = 0: SELECT 1*1 + POWER(0,1)*2 + POWER(1,2)*1 + POWER(1,3)*2
				+ POWER(2,4)*1 + POWER(2,5)*2 ; --84
k = 1:  SELECT 1*(1+1) + POWER(0,1)*(2 + 1) + POWER(1,2)*(1 + 1)
			+ POWER(1,3)*(2+1) + POWER(2,4)*(1+1) + POWER(2,5)*(2+1) ; -- 135
PL Programming
PLPython Part 2: Control Flow and Returning Sets Intermediate
We decided to continue with a Part 2 to this PL/Python series given the surprising popularity of the first. In our first article appearing in our January 2009 issue Quick Intro to PLPython we quickly went over installing PL/Python, doing a function that calls out to the operating system, and doing a quick encoder decoder. In this article we will provide examples of basic Python controls structures and how to return sets in PL/Python.
Keep in mind that while you may love Python, some things are just better done in SQL language or PL/PGSQL language so just because you can and you feel more of a comfort level with Python, doesn't mean you should forget about the other languages. SQL and PL/PGSQL are still more intimately connected to the PostgreSQL architecture and don't have an additional environment dependency to rely on. That said -- Python has a rich environment and is a much richer language in many respects so is ideal for certain kinds of problems.
PL/Python Control Flow
The If Then statementCREATE OR REPLACE FUNCTION readfile (filepath text)
RETURNS text
AS $$
import os
if not os.path.exists(filepath):
return "file not found"
return open(filepath).read()
$$ LANGUAGE plpythonu;
--Example use
SELECT readfile('/test.htm');
Try Exception This is the same exercise as above but using exceptions
CREATE OR REPLACE FUNCTION readfile_te (filepath text)
  RETURNS text
AS $$
 import os
 try:
  return open(filepath).read()
 except (IOError, OSError):
   return "file not found"
$$ LANGUAGE plpythonu;

## Example Use
SELECT readfile_te('/test.htm');
For loops and returning sets Sadly even in the 8.4 incarnation, it appears you can not pass in arrays as arguments in Pl/Python. If you do they get silently cast to text. So to compensate you can pass in text with some sort of delimeter and convert it to a Python array as needed.
However, you can return sets as an output of Pl/Python. Below is a very pointless trivial example that takes a | delimited string and converts it to a set of integers representing the length of each string.
CREATE OR REPLACE FUNCTION dosomething_withtext (strstuff text)
  RETURNS SETOF integer
AS $$
 astrstuff= strstuff.split('|');
 alens = [];
 for x in astrstuff:
  alens.append(len(x));
 return alens;
$$ LANGUAGE plpythonu;
One of the great things introduced in 8.4 was the ability to use any set returning function in the SELECT -- not just SQL and C functions. So Now you can do something like the below which would have required what we called a trojan hack in prior versions.
-- Example use
CREATE TABLE test_strings(test_id serial PRIMARY KEY NOT NULL, test_string text);
INSERT INTO test_strings(test_string)
VALUES ('abc|def|ghijkl'),('john|jack|jill');

SELECT test_id, dosomething_withtext(test_string)
FROM test_strings;


 test_id | myword
---------+--------
       1 | 3
       1 | 3
       1 | 6
       2 | 4
       2 | 4
       2 | 4
While Loops
Here we see the while loop in action with the classic fibonacci function in Python
CREATE OR REPLACE FUNCTION pyfib(n bigint)
 RETURNS SETOF bigint
 AS $$
  a, b = 0, 1
  fibnum = []
  while b < n:
   fibnum.append(b)
   a, b = b, a+b
  return fibnum
 $$ LANGUAGE plpythonu;


-- Example in action
SELECT i
  FROM pyfib(10) As i;
 i
---
 1
 1
 2
 3
 5
 8


 --Which also allows us to do wtf
 SELECT wtf.test_id, SUM(wtf.fib) As tot_fib
 FROM (SELECT test_id, pyfib(dosomething_withtext(test_string)) As fib
    FROM test_strings) As wtf
 GROUP BY wtf.test_id;

  test_id | tot_fib
---------+---------
       2 |      21
       1 |      20
In our next exploration into PL/Python we will cover pulling data from postgresql and writing triggers and aggregate functions.
PL Programming
PLPython Part 3: Using custom classes, pulling data from PostgreSQL Intermediate
One of the great things about Python is the plethora of free libraries around to do very cool things from Engineering, statistical modeling, to BioInformatics.
In this Part we shall play around with a simple but pretty neat package called ASCII Plotter - we found at Python Package Index which appears to be kind of a CPAN except for Python instead of Perl.
For more details on using PL/Python check out PostgreSQL docs PostgreSQL 8.3 PL/Python docs
The ASCII Plotter package can also be dowloaded directly from http://www.algorithm.co.il/blogs/index.php/ascii-plotter/
Install ASCII Plotter classes
- Download aplotter.zip from above website and extract.
- This extracts to one file called aplotter.py
- To install do the following - copy aplotter.py to your python25/lib folder (on windows its usually C:\Python25\lib and on Linux (/usr/lib/python2.5)
Using Python contribs in PL/Python and embedding classes
Lets quickly test by writing a function:
Now there are a bunch of functions in the aplotter lib, but the easiest to use is the plot function. Unfortunately the plot function does a print instead of a return which writes to stdout. To use in our PL/Python, we need to be able to grab that text instead of outputting to screen. I found this trick that seems to work nicely which is documented at redirecting python's print statements to a file except its a bit of a misnomer in that it tells you how to output to a buffer which is just what the doctor ordered.
Using our highly advanced copy and paste skills with artistic improvisation -- we have this
CREATE OR REPLACE FUNCTION dofunkyplot (param_anum integer)
  RETURNS text
AS $$
 import aplotter
 import sys
 class WritableObject:
	def __init__(self):
		self.content = ''
	def write(self, string):
		self.content = self.content + string
 saveout = sys.stdout
 outbuffer = WritableObject()
 sys.stdout = outbuffer
 #range (param_anum) will return array
 #consisting of 0 to param_num - 1 and formula
 # gets applied to each element
 # [1.1*x/(2 + x) for x in range(2)] -> [0 1.1/3]
 aplotter.plot([1.1*x/(2 + x) for x in range(param_anum)])
 sys.stdout = saveout
 return outbuffer.content
$$ LANGUAGE plpythonu;
And now we can impress our friends with tricks like this: The below example will draw 2 plots.
SELECT dofunkyplot(n)
FROM generate_series(5,20, 10) As n;
  |
   +0.73                                                                    *
   |                                                               ---------
   |                                                      ---------
   |                                             ---------
   |                                    ---------
   |                                ----
   |                           -----
   |                      -----
   |                 -----
   |               //
   |             //
   |           //
   |         //
   |       //
   |     //
   |   //
   | //
---+0-----------------------------------------------------------------------+---
   +0                                                                     +4

   |
   +0.96                                                               -----*
   |                                              ---------------------
   |                                    ----------
   |                         -----------
   |                    -----
   |               -----
   |             --
   |          ---
   |        //
   |      //
   |    //
   |   /
   |  /
   | /
   | /
   |/
   /
---+0-----------------------------------------------------------------------+---
   +0                                                                    +14
Reading PostgreSQL data from PL/Python
Now plotting functions is nice, but sometimes we are asked to plot data in a database. Go figure why anyone would want to do that. Below makes fake data, function reads data from a PostgreSQL table and plots it.
##Plotting fake data but lets pretend it is real
CREATE TABLE mydata(pt_id serial, pt_observation numeric(10,4));
INSERT INTO mydata(pt_observation)
	SELECT n*pi()*random()*10
		FROM generate_series(1,15) As n;


CREATE OR REPLACE FUNCTION doplotmydata (param_numitems integer)
  RETURNS text
AS $$
 import aplotter
 import sys
 class WritableObject:
	def __init__(self):
		self.content = ''
	def write(self, string):
		self.content = self.content + string
 saveout = sys.stdout
 outbuffer = WritableObject()
 #lets us just plot the first 10 items
 rv = plpy.execute("SELECT pt_id, pt_observation FROM mydata",param_numitems);
 sys.stdout = outbuffer
 #make pt_id x and pt_observation y
 aplotter.plot([x['pt_id'] for x in rv], [y['pt_observation'] for y in rv]);
 sys.stdout = saveout
 return outbuffer.content
$$ LANGUAGE plpythonu;

##and now to test
SELECT doplotmydata(20);
309.87                                            |                            +
                         /|         \
                        / |        | \
                         /  |        |  \
                       //    |       |   \            *
                      /      |      |     \\         /
                      /      |      |      \        /
                       /        |     |       \       /
                       /        |    |         \     /
                      /         |    |          \   /
            \         \       /         |    |           \  /
             /\        / \      /          |  |             \/
            /  \      /   \    /           |  |              /
           /    \    /     \   /           |  |
           //      \  /       \ /             ||
        -----         \/         \/             ||
    ------               /          /             ||
5.5967==-----------------------------------------------|--------------------+--+
   +1                                                                    +15
PL Programming
PLPython Part 4: PLPython meets aggregates Intermediate
In our August 2008/ September 2008 issue we demonstrated the power of PostgreSQL to create median and MS Access-like first and last aggregate functions in SQL language. In this article we shall demonstrate how to create aggregates with Python. We shall call this function agg_plot. What it will do is plot each grouping of data and return a plot for each grouping. The steps we covered in those articles can be applied here.
For this part, we shall use the same library we discussed in PLPython Part 3: Using custom classes, pulling data from PostgreSQL.
Creating Aggregate functions with PL/Python
Our basic approach is as follows:
- Since PL/Python does not support arrays as input, our aggregator will form a pipe delimeted list inputs as a string using plot_databuild function (which although we wrote it in python need not be and probably more efficient to write in plpgsql
- As the final step of the aggregation, this is fed to our plot_numbers function -- which converts this to an array of strings and then converts to an array of numbers to be fed to the plotter
Code is shown below and final output
##create agg
CREATE OR REPLACE FUNCTION plot_numbers(param_dataset text)
  RETURNS text AS
 $$
 import aplotter
 import sys
 class WritableObject:
	def __init__(self):
		self.content = ''
	def write(self, string):
		self.content = self.content + string
 saveout = sys.stdout
 outbuffer = WritableObject()
 sys.stdout = outbuffer
 #convert our string of | delimited numbers to an array
 adataset = param_dataset.split('|')
 #pipe in converting each string to number
 aplotter.plot([float(y) for y in adataset])
 sys.stdout = saveout
 return outbuffer.content
$$ LANGUAGE plpythonu;

CREATE OR REPLACE FUNCTION plot_databuild(param_dataset text, param_item numeric)
  RETURNS text AS
 $$
  if param_dataset is None :
	return str(param_item)
  return param_dataset + '|' + str(param_item)
$$ LANGUAGE plpythonu;

CREATE AGGREGATE agg_plot(numeric) (
  SFUNC=plot_databuild,
  STYPE=text,
  FINALFUNC=plot_numbers
);

##Plotting fake data but lets pretend it is real
CREATE TABLE mydata2(pt_id serial, pt_observation numeric(10,4), graph_id integer);
INSERT INTO mydata(pt_observation, graph_id)
	SELECT n*pi()*random()*10, generate_series(1,3)
		FROM generate_series(1,15) As n;

#and now to test
SELECT graph_id, agg_plot(pt_observation)
 FROM mydata2
 GROUP BY graph_id
 ORDER BY graph_id;
Which gives us this:
1; |
   +378.733                                                      \
   |                                                            /\          *
   |                                                           /  \        /
   |                                                          /   \        /
   |                                                         /     \      /
   |                                                        /      \      /
   |                                         \              /       \    /
   |                                        / \\           /        \    /
   |                                       /    \\-      //          \  /
   |                         \             /       ----//            \  /
   |                    -----\            /                           \/
   |                   /      \          /                            \/
   |                 //        \         /                             /
   |          -----//           \       /
   |         /                   \      /
   |       //                     ------
   |      /
---+0.86//------------------------------------------------------------------+---
   +0                                                                    +14

2; |
   +333.964                                                            -----*
   |                                                                  /
   |                                                                //
   |                                                               /
   |                                              \              //
   |                                    \        /\             |
   |                                   / \\    // \             |
   |                                  /    \\//    \           |
   |                                 /             \           |
   |                                /               \          |
   |                               /                \         |
   |               \              /                  \        |
   |              / \             /                  \       |
   |             /   \\      -----                    \      |
   |    -       /      \-----                         \      |
   |  -- -----//                                       -    |
   ---                                                  --  |
---+0.26--------------------------------------------------==|---------------+---
   +0                                                                    +14

3; +0                                                                    +14
   +344.31                                             -
   |                                                  | ----|
   |                                                  |     |
   |                                                 |      |
   |                                                 |      |
   |                                                 |       |
   |                                                |        |
   |                                                |        |
   |                                                |         |             *
   |                                               |          |            /
   |                                               |          |          //
   |                                    \          |           |       //
   |                    -              / \        |            |      /
   |                   / --           /   \       |            |     /
   |          \       /    --\       /     \      |             |   /
   |    ------ \\    /        \\    /       \   //              |  /
   |  --         \\//           \\//         ///                | /
   +15.4662                                                      /
---+------------------------------------------------------------------------+---
PL Programming
How to create multi-column aggregates Intermediate
PostgreSQL 8.2 and above has this pretty neat feature of allowing you to define aggregate functions that take more than one column as an input. First we'll start off with a rather pointless but easy to relate to example and then we'll follow up with something a bit more interesting.
For more examples of creating aggregates in PostgreSQL, check out our other articles:
- Aug/Sept 2008: Build Median Aggregate Function in SQL
- Aug/Sept 2008: More Aggregate Fun: Who's on First and Who's on Last
- Feb/March 2009: PLPython Part 4: PLPython meets aggregates
Product Sum
We have all seen aggregate functions that take one column as argument, but what about ones that take two or three or four or more. Why would you ever want to do this? The first example we will show is one that puts me to sleep, but demonstrates the point. We'll call it the prodsum. What it does is this.
prodsum(a,b) = a1*b1 + a2*b2 + a3*b3 ....an*bn
Any astitute observer will observe that this is just a lame use of something as powerful as multicolumn aggregates because you can easily simulate it with the below. Its only nice because it allows us to validate our result.
prodsum(a,b) = SUM(a*b)
You would form the aggregate product sum by doing this
CREATE OR REPLACE FUNCTION prod_state(prev numeric, e1 numeric, e2 numeric)
    RETURNS numeric AS
$$
    SELECT COALESCE($1,0) + COALESCE($2*$3,0);
$$
LANGUAGE 'sql' IMMUTABLE;

CREATE AGGREGATE prodsum(numeric, numeric)(
    SFUNC=prod_state,
    STYPE=numeric,
    INITCOND=0
);
Now to validate that it is doing the right thing..
SELECT k,
    prodsum(i,j + k) As prodsum ,
    sum(i*(j + k)) As regsum
FROM generate_series(1,4) As i
    CROSS JOIN generate_series(1,2) As j
    CROSS JOIN generate_series(0,1) As k
GROUP BY k
ORDER BY k;


 k | prodsum | regsum
---+---------+--------
 0 |      27 |     27
 1 |      45 |     45
Something different
Now this example is a little trickier to simulate without an aggregate function that takes more than one argument, so we won't bother
funky_agg(a,b) = a10*b1 + a21*b2 ...ann-1*bn
--Funky agg CREATE OR REPLACE FUNCTION funky_state(prev numeric[2], e1 numeric, e2 numeric) RETURNS numeric[2] AS $$ SELECT ARRAY[CASE WHEN $1[2] = 0 THEN 1*$3 ELSE $1[1] + POWER($2,$1[2])*$3 END, $1[2] + 1] ; $$ LANGUAGE 'sql' IMMUTABLE; CREATE OR REPLACE FUNCTION funky_final(last numeric[2]) RETURNS numeric AS $$ SELECT $1[1]; $$ LANGUAGE 'sql' IMMUTABLE; CREATE AGGREGATE funky_agg(numeric, numeric) ( SFUNC=funky_state, STYPE=numeric[2], FINALFUNC=funky_final, INITCOND = '{1,0}' ); --The foos SELECT i,j,k FROM generate_series(0,2) As i CROSS JOIN generate_series(1,2) As j CROSS JOIN generate_series(0,1) As k ORDER BY k,i,j;i | j | k ---+---+--- 0 | 1 | 0 0 | 2 | 0 1 | 1 | 0 1 | 2 | 0 2 | 1 | 0 2 | 2 | 0 0 | 1 | 1 0 | 2 | 1 1 | 1 | 1 1 | 2 | 1 2 | 1 | 1 2 | 2 | 1 (12 rows)SELECT k , funky_agg(foo.i,foo.j + foo.k) As what FROM (SELECT i,j,k FROM generate_series(0,2) As i CROSS JOIN generate_series(1,2) As j CROSS JOIN generate_series(0,1) As k ORDER BY k,i,j) As foo GROUP BY k ORDER BY k;k | what ---+---------------------- 0 | 84.0000000000000000 1 | 135.0000000000000000
Checking our math by expanding by hand:
k = 0: SELECT 1*1 + POWER(0,1)*2 + POWER(1,2)*1 + POWER(1,3)*2
				+ POWER(2,4)*1 + POWER(2,5)*2 ; --84
k = 1:  SELECT 1*(1+1) + POWER(0,1)*(2 + 1) + POWER(1,2)*(1 + 1)
			+ POWER(1,3)*(2+1) + POWER(2,4)*(1+1) + POWER(2,5)*(2+1) ; -- 135
PL Programming
PLPython Part 5: PLPython meets PostgreSQL Multi-column aggregates and SVG plots Advanced
In our PLPython Part 4: PLPython meets aggregates we demonstrated the power of PostgreSQL in combination with PLPython to create a sequence of ascii plots by using the power of aggregation. Our friend Simon Greener over at Spatial Db Advisor told me the example was clever but ascii plots was so 70ish and ugly, why didn't I do SVG plots? He felt people being predominantly visual would be caught up in the ugliness of Ascii plots and miss the point. At least Bob found them neat and can appreciate the elegance in simplicity, thanks Bob..
To make it up to Simon, we shall demonstrate 2 features we left out in our prior article.
- Pretty SVG graphs -- so I don't have to hear more about SVG from Simon and how I'm caught in the 70s.
- Ability to plot a schedule -- schedule item, start date, end date using a multi-column aggregate function. Here is a good use for multi-column aggregates or at least I think so. (Yeh for Multi-column aggregates)
If you are into spatial processing in the database or how many ways you can play with XML particularly Oracle Locator, Oracle Spatial, PostGIS and SQL Server 2008, we highly recommend Simon's articles.
Python meets PostgreSQL multi-column aggregates
In this article we shall demonstrate how to create multi-column aggregates with PL/Python. Note you can do this with any PL or SQL language in PostgreSQL, but Python happens to have a lot of nifty libraries we wanted to put to use. For this exercise, We shall create a function agg_svgschedule. What it will do is plot each grouping of data and return an svg schedule plot for each grouping. This aggregate will take 3 columns - a schedule item, a start date and an end date. The steps we covered in How to create multi-column aggregates, can be applied here.
Our basic approach is as follows:
- Download and install this nifty MIT-Licensed SVG plot library we found for Python called py-svg http://sourceforge.net/projects/py-svg and borrow it.
- Since PL/Python does not support arrays as input, our aggregator will form a pipe, | delimeted list inputs as a string using svgplot_scheduledatabuild function (which although we wrote it in python need not be and probably more efficient to write in plpgsql). It must be noted that this particular library takes a single paired array of data points. So the number of elements must be in multiples so we need only one delimiter as we had in our ascii plot example.
- As the final step of the aggregation, this is fed to our svgplot_scheduledata function -- which converts this to an array of strings to be fed to the plotter
- The other nice thing about this library is that it doesn't use print, so we don't need to redirect the stdout as we had to with the ascii plot
- Note this SVG library contains other things such as pie charts, regular graphs, bar charts, but we thought the schedule one looked kind of nifty and made the most sense for aggregate svg plots
Install Py-SVG
Installing Py-SVG is pretty easy. At the command-line run the following:
- Download the Py-SVG package py-svg http://sourceforge.net/projects/py-svg
- Extract it
- From command line either on linux or window run:
C:\Python25\python /path/to/pysvg/setup.py install
For linux users its usually:
/usr/bin/python2.5/python /path/to/pysvg/setup.py install
Code is shown below and final output
CREATE OR REPLACE FUNCTION svgplot_schedule(param_dataset text)
  RETURNS text AS
 $$
  from SVG import Schedule
  title = "Schedule"
  g = Schedule.Schedule(dict(
      width = 640,
      height = 480,
      graph_title = title,
      show_graph_title = True,
      key = False,
      scale_x_integers = True,
      scale_y_integers = True,
      show_data_labels = True,
      show_y_guidelines = True,
      show_x_guidelines = True,
      # show_x_title = True, # not yet implemented
      x_title = "Time",
      show_y_title = False,
      rotate_x_labels = True,
      rotate_y_labels = False,
      x_label_format = "%m/%d",
      timescale_divisions = "1 day",
      add_popups = True,
      popup_format = "%m/%d/%y",
      area_fill = True,
      min_y_value = 0,
      ))
  #convert our string of | delimited values to an array
  adataset = param_dataset.split('|')
  #pipe in converting each string to number
  g.add_data(dict(data=adataset, title="Data"))
  return g.burn()
$$ LANGUAGE plpythonu;

CREATE OR REPLACE FUNCTION plot_svgschedule_databuild(param_dataset text, param_schitem text, param_schstart date, param_schend date)
  RETURNS text AS
 $$
  if param_dataset is None :
    return str(param_schitem) + '|' + str(param_schstart) + '|' + str(param_schend)
  return param_dataset + '|' + str(param_schitem) + '|' + str(param_schstart) + '|' + str(param_schend)
$$ LANGUAGE plpythonu;


CREATE AGGREGATE agg_svgschedule(text,date, date) (
  SFUNC=plot_svgschedule_databuild,
  STYPE=text,
  FINALFUNC=svgplot_schedule
);

##Plotting fake data but lets pretend it is real
CREATE TABLE mysvg_scheduledata(pt_id serial, pt_person text, pt_schitem text, pt_start date, pt_end date);
INSERT INTO mysvg_scheduledata(pt_person, pt_schitem, pt_start, pt_end)
    SELECT DISTINCT ON(pers, activity, startdate) pers, activity, startdate, enddate
    FROM
    (SELECT (ARRAY['Jack', 'Jill', 'Tom'])[i] As pers,
        (ARRAY['Gym', 'Crew', 'Programming', 'Skiing'])[CAST(random()*10*j As integer) % 3 + 1] As activity,
             CURRENT_DATE + CAST(CAST(k As text) || ' day' as interval) As startdate,
                CURRENT_DATE + CAST(CAST(k + (CAST(random()*10*j As integer) % 3 + 1) As text) || ' day' as interval) As enddate
        FROM  generate_series(1,3) As i
                CROSS JOIN  generate_series(1,4) As j
                CROSS JOIN generate_series(1,3) As k
            ) As foo
    ORDER BY pers, activity, startdate;


#and now to test
SELECT pt_person,  agg_svgschedule(pt_schitem, pt_start, pt_end) As svggraph
 FROM (SELECT pt_person, pt_schitem, pt_start, pt_end
        FROM mysvg_scheduledata
            ORDER BY pt_person, pt_schitem, pt_start, pt_end) As foo
 GROUP BY pt_person
 ORDER BY pt_person;
Which gives us this:
| pt_person | svggraph |
|---|---|
| Jack |  |
| Jill |  |
| Tom |  |
Special Feature
PL Python Cheatsheet Overview
PL/Python is the procedural language for PostgreSQL that allows you to write database stored functions and triggers in Python. Python has proved to be a charming language and when used for where it excels, enhances the power of PostgreSQL quite nicely. Unfortunately we can't quite capture all its charm in a single pager cheat sheet, but hopefully this will give you a sense of its usefulness.
Below is a Thumbnail view of the PL\Python cheat sheet. This is by no means comprehensive, but are the features we thought may be useful to know.
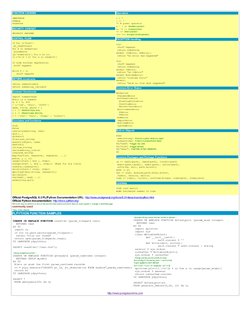
PDF Portrait version 8.5 x 11" of this cheatsheet is available at PL/Python Cheatsheet 8.5 x 11 and also available in PDF A4 format and HTML.
Also check out our accompanying tutorials on the topic of PL/Python: