In part 1 of this series on PostgreSQL 9.0 planner outputs, we demonstrated how to render explain plans in YAML, JSON, and XML using the new explain features in PostgreSQL 9.0. In this second part, we'll demonstrate how to build a user interface that allows you input a JSON formatted explain plan and have it render into a printable, navigateable display using JQuery, javascript and a little bit of HTML coding. In part 3 we'll do something similar using XML and XSLT programming.
For those who aren't familiar with JQuery, it is an MIT licensed javascript library that is fairly light weight and allows you to inspect and change html elements with fairly intuitive syntax, has some nice ajax methods and tools for converting xml/json to native objects that can be manipulated. You can check it out at JQUERY.
We are not experts in JQuery, but from what we have used of it, we really like it and the fact the base package is MIT licensed, fairly light weight and lots of plugins available for it are real pluses.
The most difficult thing I think most people find about reading explain plans is that they are upside down; it starts with a conclusion and backtracks how to arrive at it. Humans by nature think about planning steps from start to finish. In order to make an explain plan understandable to mere mortals, we generally display them upside down or having the child-nodes shown left most. We shall follow that approach.
Our Interface for inputing plans
For this exercise and subsequent exercise, we are going to create a simple web form interface that has a few parts.
- A textarea box for you to paste the JSON/XML/whatever planner output. For first phase we'll just support JSON.
- A button for you to click to render your output in breathtaking icons and colors.
- A text field you can put a cost break point so sub plans with greater cost than specified are highlighted
- A button to toggle planner detail on and off
For those that are impatient, our little interface can be tried here PostgreSQL JSON Explain Plan Viewer. We left a snippet of JSON in the text area for easier testing. That JSON can be replaced with any PostgreSQL Explain Plan JSON output.
You can also download the source code from here
The basic form looks like 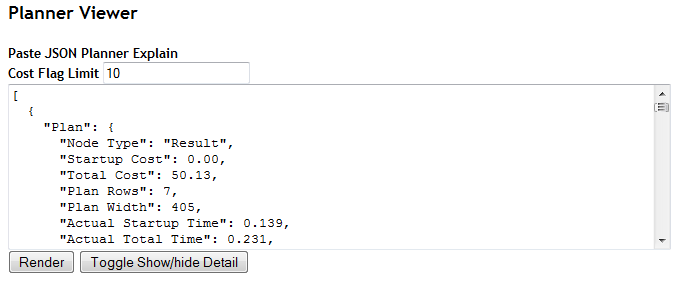
The html for our simple form is shown below
<form id="frmplanner">
    <b>Paste JSON Planner Explain </b><br />
    <b>Cost Flag Limit</b> <input type="text" id="costflag" name="costflag" value="10" />
    <br />
    <textarea id="planneroutput" name="planneroutput" cols="80" rows="10"></textarea><br />
    <input type="button" id="cmdrender" name="cmdrender" value="Render" onclick="drawPlan()"/>
    <input type="button" value="Toggle Show/hide Detail" onclick="toggleDetail()" />
</form>
The breathtaking visual plan
Now we come to the harder part of rendering our mouth watering explain plan view. For this piece we have chosen to use JQuery and a JQuery plugin called corner plugin, to get some stylistic rouned corners.
Since we are lazy programmers who lack any artistic ability, we borrowed some of the images used for explain plans from PgAdmin III project. The problem with borrowing those icons, is that we needed them in PNG or JPG format, but PgAdmin source code has them in xpm format in the \include\images folder of the project.
ImageMagick, another great Apache style licensed open source toolkit, came to our rescue to convert XPM -> PNG. The trick we used was to use ImageMagick mogrify commandline tool.
mogrify -format png *.xpm
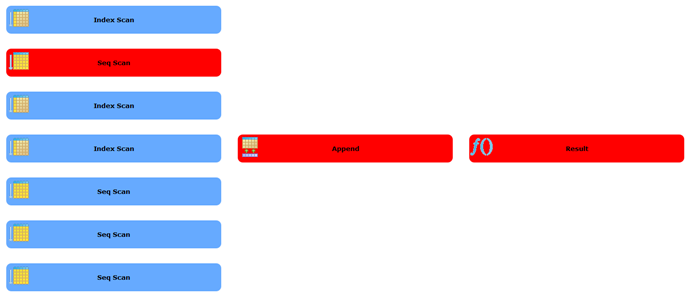
When we are done with all our programming, our rendered plan will look like this (when detail is hidden):
Nodes will look like below when expanded. We only show 2 in this picture since it takes up a lot of space.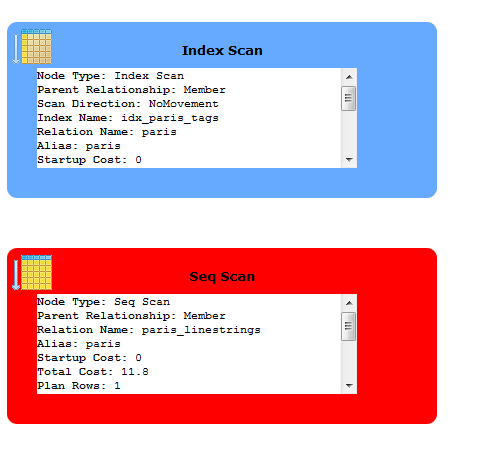
The JQuery secret sauce
The key elements for unraveling the JSON plan are:
- Use JQuery's Parse JSON function to convert to Javascript objects.
var obj = jQuery.parseJSON($('#planneroutput').val()); - Have a drawPlan function -- that parses JSON, and then calls a subplan function which recursively calls itself for each plan node that has plans.
- For the detail summary we defined a css class pgplandetail we stylized in the .css file.
- Then we use JQuery's slick ability to apply styles to a whole set of objects with same class -- to hide and unhide detail.
$('.pgplandetail').hide('slow');
The above snippet hides all objects that are of css class pgplandetail. - For the icons we assumed we could get away with going by the icon names (more or less) and they would have names similar to the plans except replacing space with _ and putting an ex in front. This does not often hold true, so you may need to rename the images.
full javascript is shown below
var detailState = 'show'

    function drawPlan(){
        var obj = jQuery.parseJSON($('#planneroutput').val());
        $('#planholder').html("<table id='tblplan'></table>");
        drawSubPlan(obj[0].Plan, '#tblplan', 'plan');
        detailState = 'show'
    }

    function getPlanImg(pgplan) {
        var imgname = "ex_" +  pgplan['Node Type'].replace(' ', '_').toLowerCase()
        if ("Join Type" in pgplan) {
            if ((pgplan['Join Type'] == 'Left' || pgplan['Join Type'] == 'Left')) {
                imgname += "_semi_join"
            }
            else
            if (pgplan['Join Type'] != 'Inner') {
                imgname += pgplan['Join Type'].replace(' ', '_').toLowerCase()
            }
        }
        imgname += ".png"
        return imgname
    }
    function drawSubPlan(pgplan, elid, pname) {
        var curplan;
        var str;
        var dive = $(elid);
        var childpanel;
        /** We insert the cell before so our display goes in opposite direction of the JSON structure **/

        curplan = pname;
        childpanel = pname + 'childs';

        dive.append("<tr><td><table id='"
            + pname + "childs'></table></td><td><div id='"
            + curplan
            + "' class='pgplan' style='background-repeat:no-repeat;background-image:url(images/" + getPlanImg(pgplan) +")'>"
            + pgplan['Node Type']
            + " <br /><div class='pgplandetail'>"
            + getPlanDetail(pgplan)
            + "</div></div></td></tr>")
        dive = $('#' + pname + 'childs');
        $('#' + curplan).corner();
        /** highlingt the plan red if the cost is above our cut off **/
        if (parseFloat(pgplan['Total Cost']) > parseFloat($('#costflag').val())) {
            $('#' + curplan).css('background-color', 'red')
        }
        /** If this plan has sub plans, unravel them **/
        if ("Plans" in pgplan) {
            for (i = 0; i < pgplan.Plans.length; i++) {
                curplan = pname + '_' + i;
                drawSubPlan(pgplan.Plans[i], '#' + childpanel, curplan);
            }
        }
    }

    function getPlanDetail(obj){
        var temp = "";
        if ("Plans" in obj) {
            temp += '<b># sub plans</b>: ' + obj.Plans.length + "<br />";
        }
        for (x in obj){
            if (x != 'Plans'){
                temp += "<b>" + x + "</b>: " + obj[x] + "<br />";
            }
        }

        return temp;

    }

    function toggleDetail(){
        if (detailState == 'show'){
            $('.pgplandetail').hide('slow');
            detailState = 'hide';
        }
        else {
            $('.pgplandetail').show('slow');
            detailState = 'show';
        }
    }