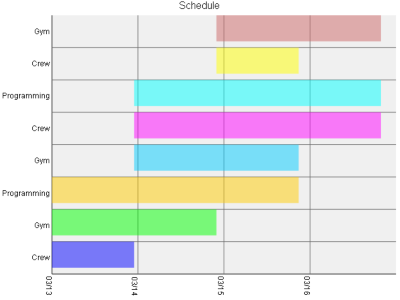
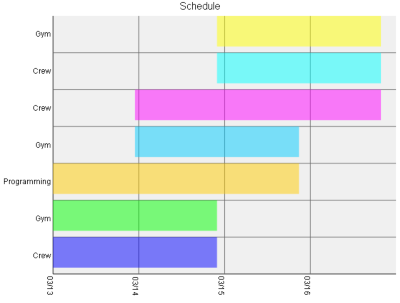
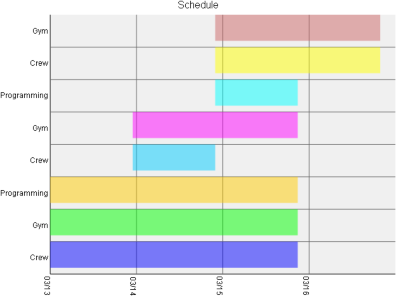
In our PLPython Part 4: PLPython meets aggregates we demonstrated the power of PostgreSQL in combination with PLPython to create a sequence of ascii plots by using the power of aggregation. Our friend Simon Greener over at Spatial Db Advisor told me the example was clever but ascii plots was so 70ish and ugly, why didn't I do SVG plots? He felt people being predominantly visual would be caught up in the ugliness of Ascii plots and miss the point. At least Bob found them neat and can appreciate the elegance in simplicity, thanks Bob..
To make it up to Simon, we shall demonstrate 2 features we left out in our prior article.
- Pretty SVG graphs -- so I don't have to hear more about SVG from Simon and how I'm caught in the 70s.
- Ability to plot a schedule -- schedule item, start date, end date using a multi-column aggregate function. Here is a good use for multi-column aggregates or at least I think so. (Yeh for Multi-column aggregates)
If you are into spatial processing in the database or how many ways you can play with XML particularly Oracle Locator, Oracle Spatial, PostGIS and SQL Server 2008, we highly recommend Simon's articles.
Python meets PostgreSQL multi-column aggregates
In this article we shall demonstrate how to create multi-column aggregates with PL/Python. Note you can do this with any PL or SQL language in PostgreSQL, but Python happens to have a lot of nifty libraries we wanted to put to use. For this exercise, We shall create a function agg_svgschedule. What it will do is plot each grouping of data and return an svg schedule plot for each grouping. This aggregate will take 3 columns - a schedule item, a start date and an end date. The steps we covered in How to create multi-column aggregates, can be applied here.
Our basic approach is as follows:
- Download and install this nifty MIT-Licensed SVG plot library we found for Python called py-svg http://sourceforge.net/projects/py-svg and borrow it.
- Since PL/Python does not support arrays as input, our aggregator will form a pipe, | delimeted list inputs as a string using svgplot_scheduledatabuild function (which although we wrote it in python need not be and probably more efficient to write in plpgsql). It must be noted that this particular library takes a single paired array of data points. So the number of elements must be in multiples so we need only one delimiter as we had in our ascii plot example.
- As the final step of the aggregation, this is fed to our svgplot_scheduledata function -- which converts this to an array of strings to be fed to the plotter
- The other nice thing about this library is that it doesn't use print, so we don't need to redirect the stdout as we had to with the ascii plot
- Note this SVG library contains other things such as pie charts, regular graphs, bar charts, but we thought the schedule one looked kind of nifty and made the most sense for aggregate svg plots
Install Py-SVG
Installing Py-SVG is pretty easy. At the command-line run the following:
- Download the Py-SVG package py-svg http://sourceforge.net/projects/py-svg
- Extract it
- From command line either on linux or window run:
C:\Python25\python /path/to/pysvg/setup.py install
For linux users its usually:
/usr/bin/python2.5/python /path/to/pysvg/setup.py install
Code is shown below and final output
CREATE OR REPLACE FUNCTION svgplot_schedule(param_dataset text)
  RETURNS text AS
 $$
  from SVG import Schedule
  title = "Schedule"
  g = Schedule.Schedule(dict(
      width = 640,
      height = 480,
      graph_title = title,
      show_graph_title = True,
      key = False,
      scale_x_integers = True,
      scale_y_integers = True,
      show_data_labels = True,
      show_y_guidelines = True,
      show_x_guidelines = True,
      # show_x_title = True, # not yet implemented
      x_title = "Time",
      show_y_title = False,
      rotate_x_labels = True,
      rotate_y_labels = False,
      x_label_format = "%m/%d",
      timescale_divisions = "1 day",
      add_popups = True,
      popup_format = "%m/%d/%y",
      area_fill = True,
      min_y_value = 0,
      ))
  #convert our string of | delimited values to an array
  adataset = param_dataset.split('|')
  #pipe in converting each string to number
  g.add_data(dict(data=adataset, title="Data"))
  return g.burn()
$$ LANGUAGE plpythonu;

CREATE OR REPLACE FUNCTION plot_svgschedule_databuild(param_dataset text, param_schitem text, param_schstart date, param_schend date)
  RETURNS text AS
 $$
  if param_dataset is None :
    return str(param_schitem) + '|' + str(param_schstart) + '|' + str(param_schend)
  return param_dataset + '|' + str(param_schitem) + '|' + str(param_schstart) + '|' + str(param_schend)
$$ LANGUAGE plpythonu;


CREATE AGGREGATE agg_svgschedule(text,date, date) (
  SFUNC=plot_svgschedule_databuild,
  STYPE=text,
  FINALFUNC=svgplot_schedule
);

##Plotting fake data but lets pretend it is real
CREATE TABLE mysvg_scheduledata(pt_id serial, pt_person text, pt_schitem text, pt_start date, pt_end date);
INSERT INTO mysvg_scheduledata(pt_person, pt_schitem, pt_start, pt_end)
    SELECT DISTINCT ON(pers, activity, startdate) pers, activity, startdate, enddate
    FROM
    (SELECT (ARRAY['Jack', 'Jill', 'Tom'])[i] As pers,
        (ARRAY['Gym', 'Crew', 'Programming', 'Skiing'])[CAST(random()*10*j As integer) % 3 + 1] As activity,
             CURRENT_DATE + CAST(CAST(k As text) || ' day' as interval) As startdate,
                CURRENT_DATE + CAST(CAST(k + (CAST(random()*10*j As integer) % 3 + 1) As text) || ' day' as interval) As enddate
        FROM  generate_series(1,3) As i
                CROSS JOIN  generate_series(1,4) As j
                CROSS JOIN generate_series(1,3) As k
            ) As foo
    ORDER BY pers, activity, startdate;


#and now to test
SELECT pt_person,  agg_svgschedule(pt_schitem, pt_start, pt_end) As svggraph
 FROM (SELECT pt_person, pt_schitem, pt_start, pt_end
        FROM mysvg_scheduledata
            ORDER BY pt_person, pt_schitem, pt_start, pt_end) As foo
 GROUP BY pt_person
 ORDER BY pt_person;
Which gives us this:
| pt_person | svggraph |
|---|---|
| Jack |  |
| Jill |  |
| Tom |  |